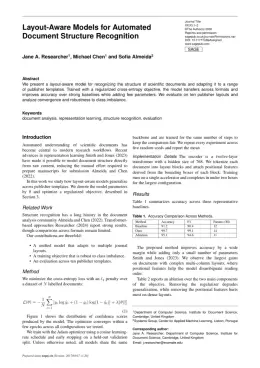
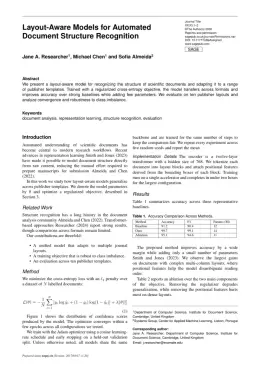
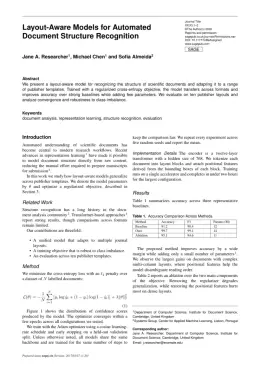
How do I write a paper in the Information Visualization format?
In DocuGuru you write your manuscript in a normal editor — no LaTeX setup required — and select the Information Visualization template. When you export, DocuGuru compiles the paper into the official SAGE format and hands you a submission-ready PDF along with the editable LaTeX source.
What reference style does Information Visualization use?
Information Visualization uses Author–year (Harvard) references, shown as author–year markers such as (Smith, 2023) in the text. DocuGuru formats every in-text citation and the reference list in this exact style automatically. A reference appears like this: Smith, A., Jones, B. and Lee, C. (2023) 'A representative article title', Information Visualization, 12(3), pp. 45–58.
Do I need to know LaTeX to submit to Information Visualization?
No. DocuGuru generates the sagej LaTeX class and compiles the PDF for you in the background, so you get a SAGE-ready Information Visualization document without writing any LaTeX. If you do want it, the LaTeX source is included in the export.
Can I import an existing draft into the Information Visualization template?
Yes. Paste or upload your current manuscript — Word, LaTeX, Markdown, or plain text — and DocuGuru reflows it into the Information Visualization format with correct headings, figures, tables, and author–year citations.
Who publishes Information Visualization?
Information Visualization is a multidisciplinary journal published by SAGE. DocuGuru's Information Visualization template matches SAGE's official submission format.
Can I export a submission-ready Information Visualization PDF?
Yes — DocuGuru produces a PDF built with the official Information Visualization template (the sagej class) that is ready to submit to SAGE, together with the matching LaTeX source files.
How much does the Information Visualization template cost?
You can start writing in the Information Visualization template for free. Exporting the final submission-ready Information Visualization PDF and LaTeX source is part of DocuGuru's paid plans — see the app for current pricing.